Music is a very integral part of my daily landscape. With a music library of nearly 13,000 songs on a constant shuffle, the music I listen to along my daily routes create a language of their own within my daily routines. Faced with the prompt of creating an "atlas," that tracks the invisible and ephemeral in my daily landscape for a week, I chose to track the music I listened along two of my routine routes: my route to my university campus, and my route to work. This music visualization atlas is an atlas that makes making that invisible language of my daily routines, visible. I tracked the music I listened to along my routine commutes, and the music I listened to at different times of the day at home. Visualizing my landscape as music, made visible the patterns (and lack of patterns) that could be found in an average week of my life. The visualizations were hand painted and the brush used carefully selected; an organic creation of the feelings the music gives me, and the colors, shapes, and movements that come to mind with each individual song.
The route, date, time of day, artists + song titles were printed on transparencies so the corresponding music visualizations could be seen with their pertinent information. Having all the information on a preceding transparent page allows for the music visualizations to be appreciated simply for their forms and colors, without the noise of extra information.
LEFT PAGE: Comparison of the music listened to during my commutes to campus versus my commutes to work. The relatively consistent pattern I found was that the music I listened to during the commutes to campus was more mellow than the music listened to during my commutes to work.
RIGHT PAGE: A sampling of visualizations of the music I listened to at home at different times of the day (morning, afternoon, night).
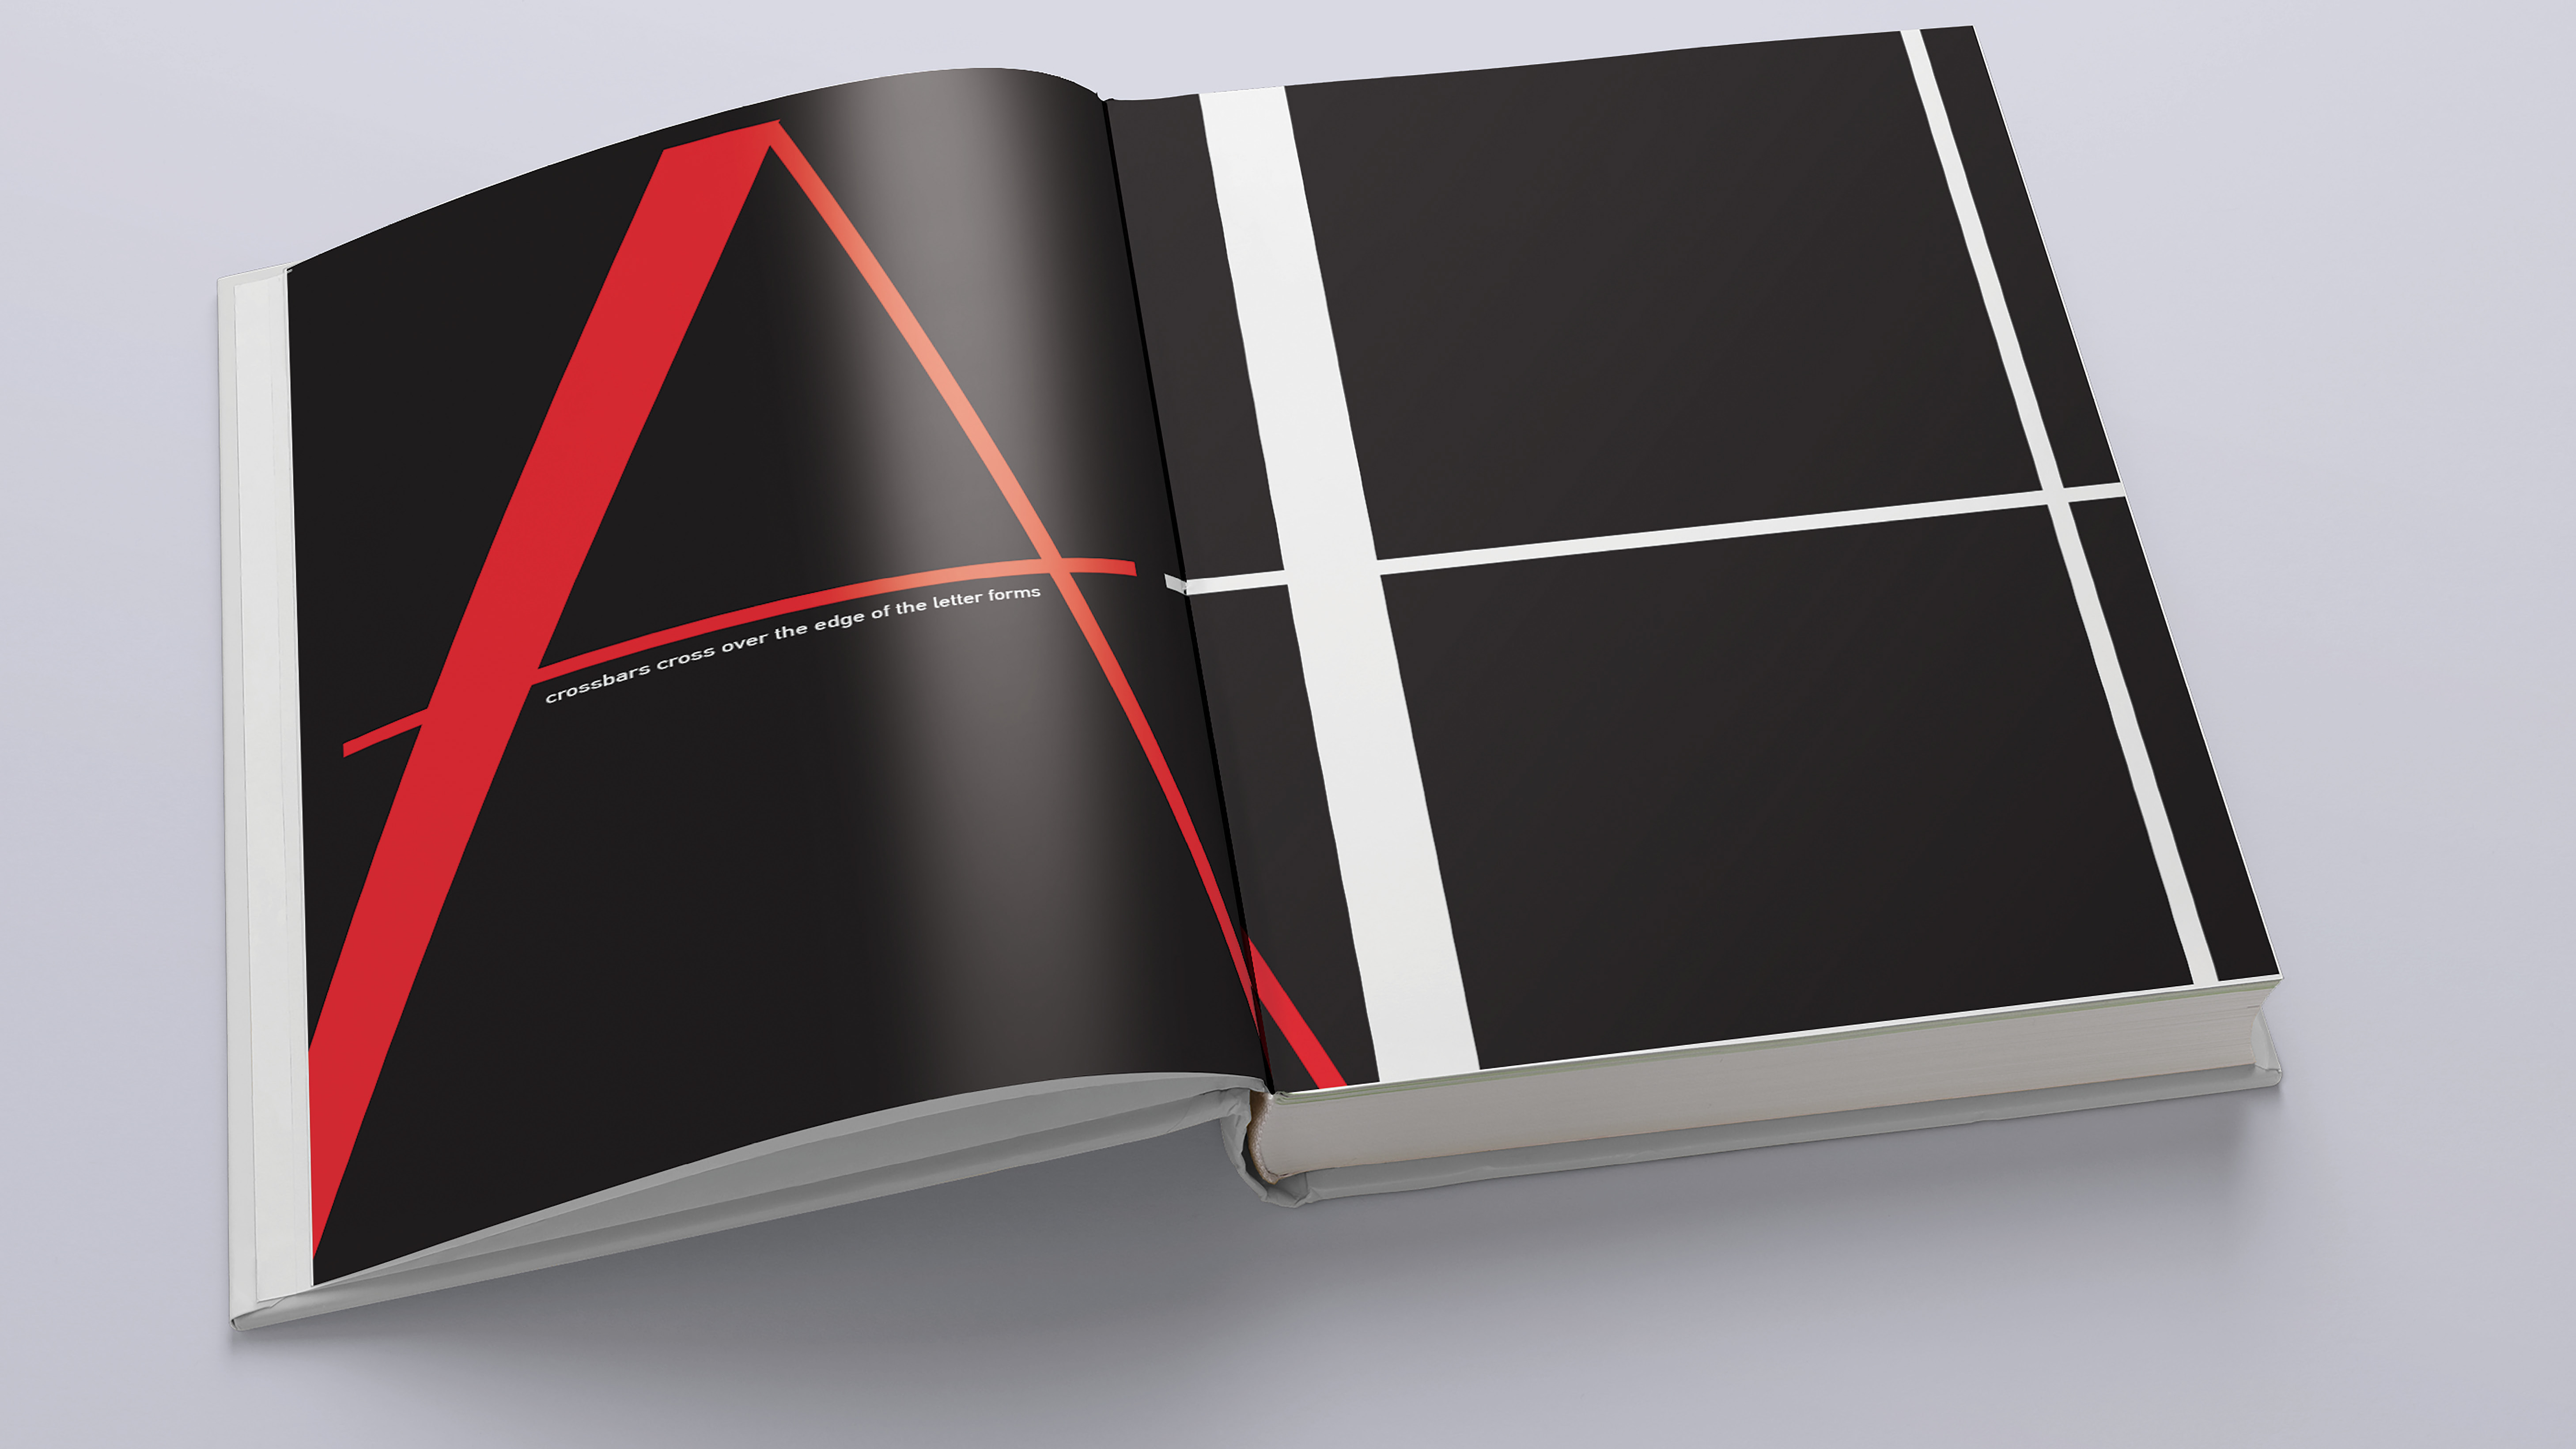
LEFT PAGE: A representation of the energy levels different music genres stimulated within me + the genres which fell most frequently into the given energy categories. The colors which correspond with the genres within each energy visualization, also correspond with the color groups most frequently visualized for songs within those given genres. In addition, the fonts selected for the different genres embed another level of music visualization; a typographic visualization of the genres.
RIGHT PAGE: Comparison of song visualizations for artists listened to multiple times
PROCESS
Initial hand drawings of a couple of my music visualizations along my commutes. In the preliminary phases of designing this atlas, I considered meshing the visualizations directly along the route. However, I stepped away from this method when I found that the drawings of the songs visualized were not always geographically accurate along the route, when taking into account actual time and distance.
